

By: Rene Garreaud. Edited by: Nicole Tondreau
We’re entering the last month of winter in central Chile, and it has felt particularly “wintry” to many of us, with low temperatures and several moderate and a few intense precipitation events. So, is the megadrought over? Unfortunately, not yet. The central map in Figure 1 shows the cumulative precipitation deficit for several cities in central Chile, from the beginning of the year up to 28 July. There is a 20% to 30% deficit in most urban centres, with the exception of Concepción, which is almost normal (0%), and Curicó, with -15%. This is in line with the forecast issued by Chile’s meteorological service (Dirección Meteorológica de Chile, DMC) and other centres, which predicted below average rainfall and the continuation of the megadrought. That said, we will need to wait for August and the spring to see how the year ends in terms of precipitation levels.
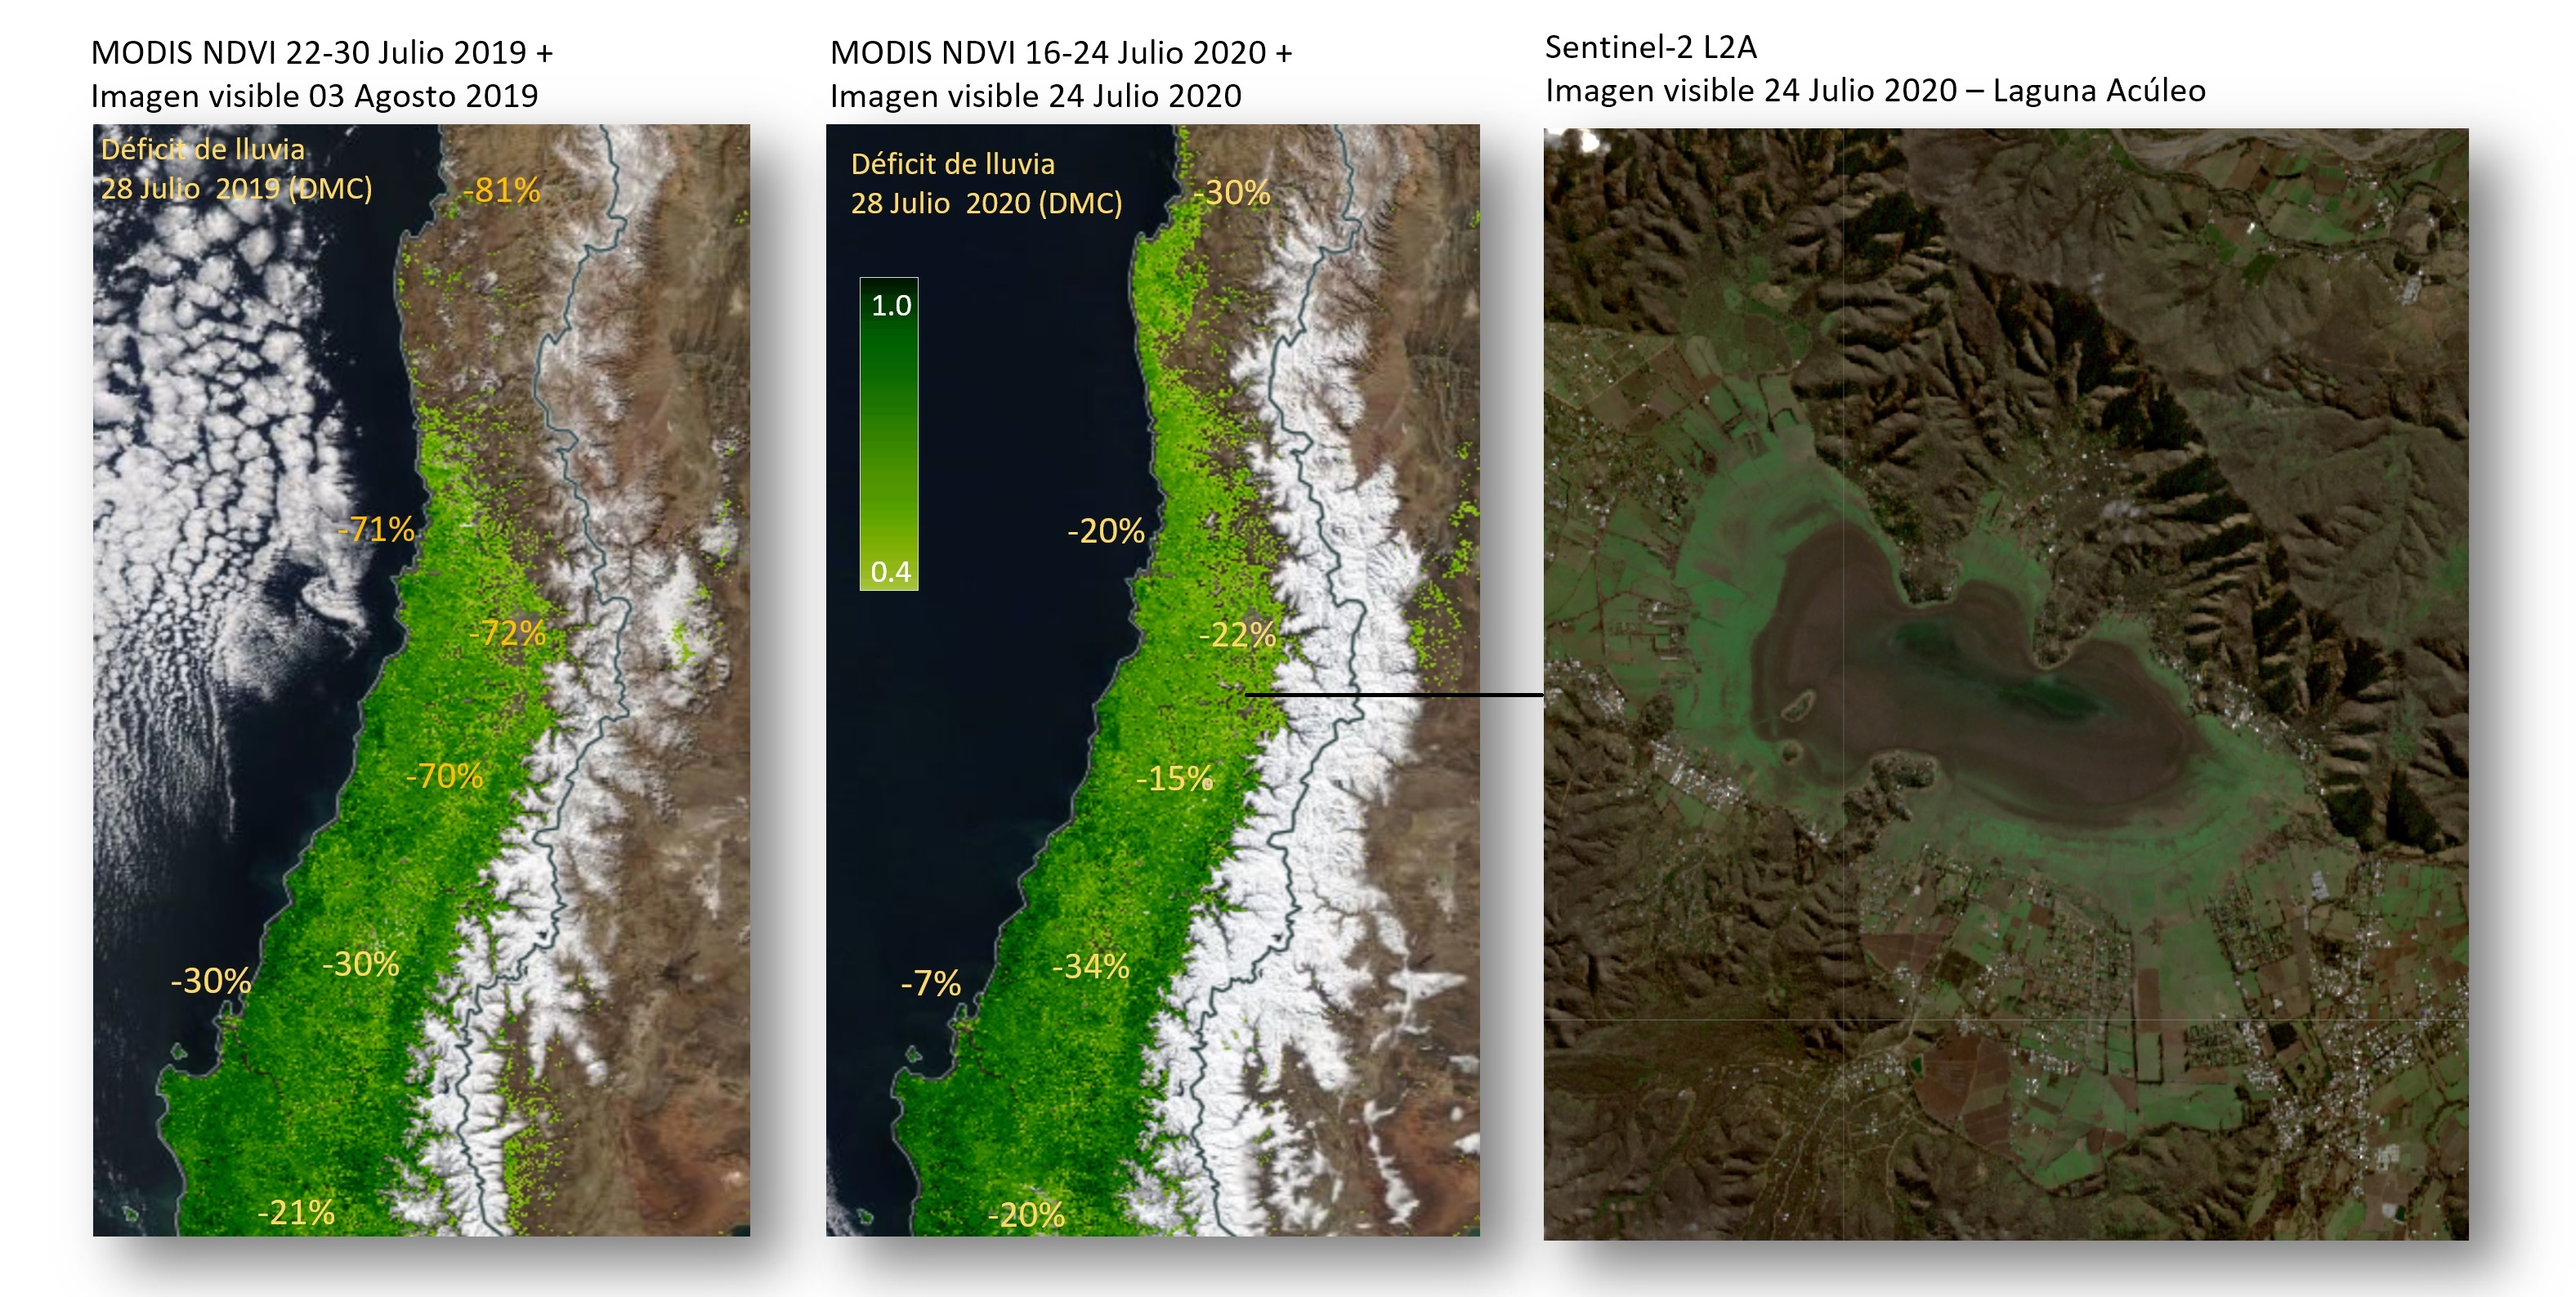
The good news is that we are a long way from the extreme drought conditions that we saw in 2019 (and prior to that in 1924, 1968, and 1998). In north-central Chile, for example, on the same date last year, deficits were above 70% (map on the left) and we wrapped up the year at close to 80%. In Santiago, although cumulative precipitation stands at 180mm, or 22% below the average for late July (231mm), it is still three times more than what we had on the same date in 2019. From Chillán to Temuco, conditions have been more or less similar for both years.
Although still below the historic average, the higher cumulative precipitation this winter has led to extensive snow cover in the Andes Mountains – suggesting better freshwater availability next summer – and more verdant vegetation (according to NDVI satellite measurements) on the coast of the northern part of the Valparaiso Region and in the Coquimbo Region. On the other hand, not all the water reserves have recovered; Laguna Aculeo remains dry even today (image on the right).
 Secures Its Continuity")

, an Endangered Species")