

René Garreaud, Deputy Director of the Center for Climate and Resilience Research CR2, and Professor at the Department of Geophysics, University of Chile
El Niño Southern Oscillation (ENSO) is a complex ocean and atmosphere phenomenon. In the sea, the thermal structure of the equatorial Pacific, from South America’s coast to Indonesia, is particularly relevant. In the atmosphere, surface pressure and wind over tropical and subtropical Pacific latitudes are crucial, and convective activity is developing in low latitudes over this ocean.
Most international centres, such as the National Oceanic and Atmospheric Administration (NOAA) and the Interamerican Research Institute (IRI), diagnose and forecast ENSO using the Niño3.4 index [1], which measures warming or cooling in the central equatorial Pacific surface. While this index correlates well with other ENSO aspects and its global impacts, it cannot capture all elements of this phenomenon, which we aim to reflect in this new CR2 Analysis.
La Niña we still await
A year ago, we were amid the development of El Niño 2023/2024, which peaked in January when the Niño 3.4 index reached 2°C (Figure 1a). A few months later, cooling began in the eastern equatorial Pacific – adjacent to Ecuador’s coast and northern Peru – and cold anomalies were observed below the sea surface, presaging a rapid transition to a moderate La Niña. Reinforcing observation-based expectations, seasonal forecast models consistently projected a warm-cold transition in the tropical Pacific. By January 2024, the average of statistical and dynamic models projected La Niña’s establishment for the June-July-August (JJA) quarter of 2024, and subsequent months’ forecasts increased these expectations. Recall that ENSO’s cold phase is associated with rainfall deficits in central Chile during winter and spring, raising alarms about water scarcity in our country, as discussed in a previous CR2 analysis that highlighted climate prediction uncertainty.
Although the Niño3.4 index declined during the austral summer and autumn of 2024, it remained slightly positive until June, and only since August has it shown slightly negative values, between -0.2 and -0.4°C. Despite this, as we approach the year’s end, we still await La Niña’s arrival (Figure 1b), and it remains unclear what halted its development. Still, we will analyse the misadventures of climate prediction over the past two years. We may learn something…
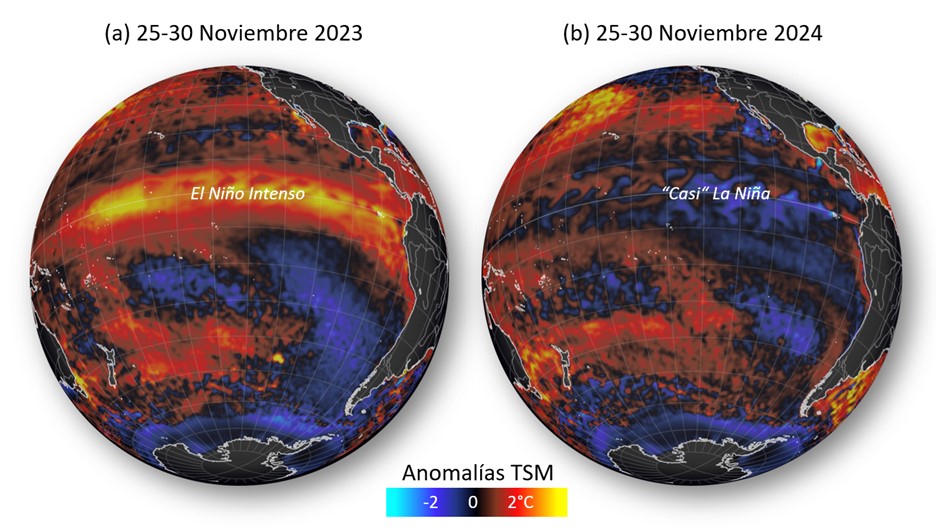
Figure 1. Sea surface temperature (SST) anomalies for (a) late November 2023 and (b) late November 2024. Data source: OI SST V2.1 / PSL / NOAA.
How did the forecasts perform?
To answer this, let’s examine the quarterly Niño 3.4 forecasts issued monthly, as shown in Figure 2. The rows show the month when a forecast was made for each quarter from 2023 to 2025, shown in columns. Each forecast represents an average of 26 models compiled by IRI in the United States. The figures correspond to the Niño3.4 index multiplied by 100 (for example, 56 is actually 0.56°C), ranging from red (positive values) through yellow (values near 0) to blue (negative values).
For example, the value -80 at the intersection of the Jan 2024 row and the SON 2024 column indicates that forecasts issued in January 2024 projected a Niño3.4 index of -0.8°C for that year’s September-October-November quarter. This forecast predicted a moderate to strong La Niña (requiring a Niño3.4 index below -0.5°C). How accurate was this forecast? Looking at the SON 2024 column in the bottom row showing observations, we see that the Niño3.4 index was only -0.26°C, meaning the ocean remained in ENSO’s neutral phase or instead in an “almost La Niña” condition, as we’ll discuss later. In other words, an imperfect forecast.
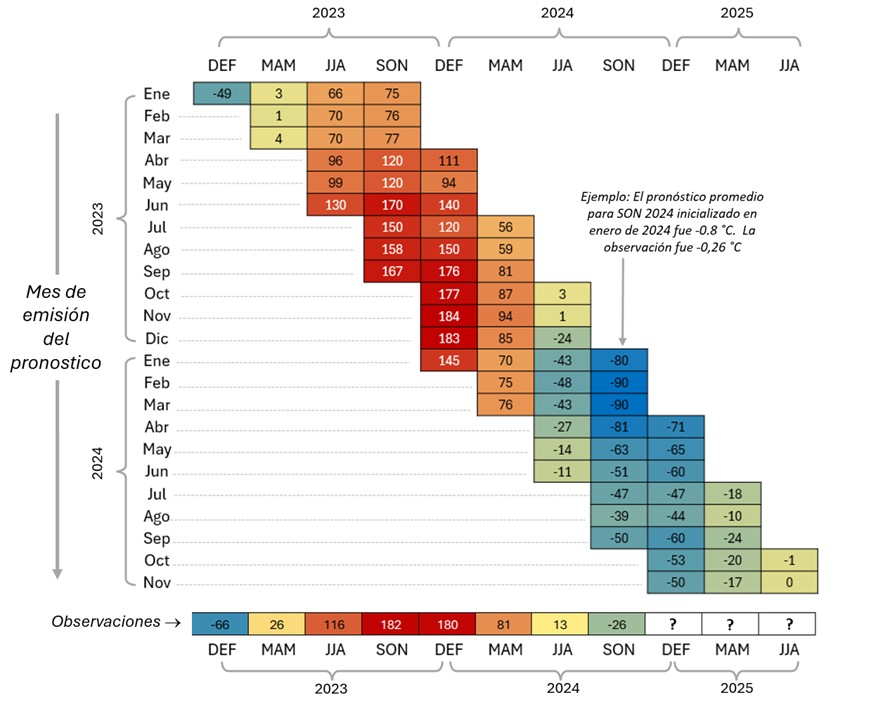
Figure 2. Summary of seasonal Niño3.4 forecasts for the years 2023 and 2024. The rows represent the months the forecast is issued, while the columns correspond to the forecast quarter. The last row shows observations. In each case, the number indicates the Niño3.4 index value (forecasted or observed) in units of °C multiplied by 100. See the text for further explanations.
Focusing on the SON 2024 column in Figure 2, we see that until June of this year, models were still forecasting the arrival of La Niña for the spring quarter with a value of -0.51 °C. As time passed, the projection became milder, reaching -0.39 °C in August, though consistently overestimating the intensity of the cooling in the equatorial Pacific. A similar pattern is observed for the forecasts for summer 2025 (DEF 2025), which has just begun. Models initialised in April predicted a Niño3.4 index of -0.71 °C, while the most recent forecast (November 2024) projects a value of only -0.5 °C, with projections for austral autumn and winter 2025 (MAM and JJA) indicating neutral conditions.
Let’s review how the forecasts performed in 2023. Again, consider the estimates for the spring quarter (SON 2023 column). In this case, as early as January 2023, the forecasts indicated El Niño’s establishment for that season. However, the projected intensity early in the year underestimated reality (+0.6 to +0.7 °C versus +1.82 °C). In contrast to this year, the autumn forecasts for 2023 increased their projections for spring and summer (DEF), closely matching the observed warming in the tropical Pacific.
So far, we have considered the average of 26 forecasts, which is usually regarded as the best available projection. Among the estimates, some differences tend to increase over time, and the spread of projections indicates their robustness. The forecasts for SON 2023, initialised in April 2023, were pretty consistent, with only two models indicating conditions below the Niño3.4 threshold of +0.5 °C (Figure 3a). In the case of 2024 (Figure 3b), the projections were more dispersed, with seven models forecasting neutral conditions for spring (SON).
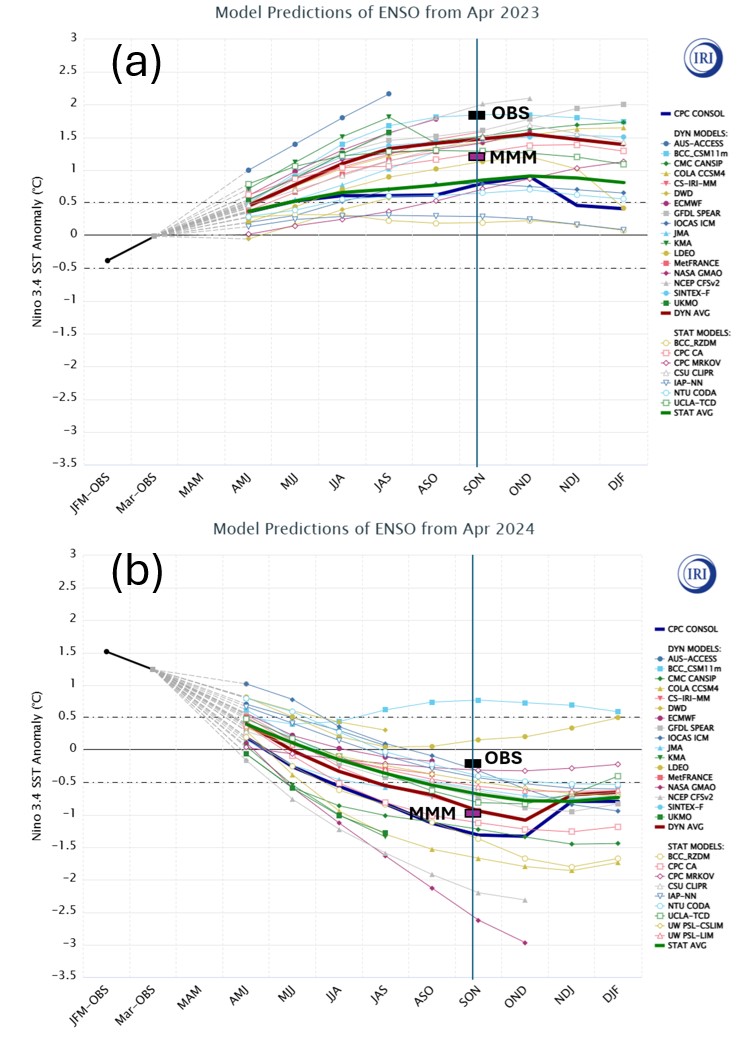
Figure 3. Forecast plumes of the Niño3.4 index during (a) 2023 and (b) 2024. The forecasts issued in April of the respective year are considered in both cases. Each thin curve represents a model’s forecast for subsequent quarters. For instance, SON corresponds to September, October, and November. The thick curves represent the average of projections based on dynamic models (green), statistical models (violet), and the CPS consensus (blue). Source: IRI-U. of Columbia, USA
The world is more complex
As mentioned earlier, the Niño3.4 index cannot capture all ENSO elements. For instance, in the past quarter (SON 2024), Niño3.4 was only -0.26°C and La Niña was not declared. However, other aspects, such as absent convection over the central Pacific or intensification of the subtropical Pacific anticyclone, are characteristic of ENSO’s cold phase. Even so, ad hoc indices of these elements also showed mild anomalies. Thus, rather than referring to the current condition as ENSO’s “neutral phase,” it’s more appropriate to consider that the coupled ocean-atmosphere system in the tropical Pacific is in an “almost La Niña” phase, and certain teleconnections can activate in this scenario.
A second complex factor involves global warming’s effect on ENSO. This is a highly relevant issue still without a clear answer about the future of El Niños and La Niñas. Beyond these phenomena’s complex dynamics, the operational definition of Niño3.4 has a problem. Remember that this index is the difference between the observed sea surface temperature (SST) value in the Niño3.4 region minus the “climatological normal” (also referred to as climatology), defined as the average SST over 30 years.
In a stable climate (with interannual variations but no long-term trend), the specific years defining that period are insignificant. However, there is a warming trend across most of the globe, and the Niño3.4 region has warmed at approximately 0.1°C per decade, as illustrated in Figure 4. The mean Sea Surface Temperature (SST) value for the September-October-November (SON) quarter between 1950 and 1980 was 26.3°C, while the average between 1990 and 2020 reached 26.7°C. The observed SST value in SON 2024 was 26.5°C. The Niño3.4 index value we have previously reported considers the most recent climatological normal: 26.5°C – 26.7°C = -0.2°C, representing a weak *cold* anomaly. However, had we employed the earlier climatological normal, the index would have been 26.5°C – 26.3°C = +0.2°C, resulting in a weak *warm* anomaly. Thus, due to gradual ocean warming, “historical” climatology results in reduced intensity (Niño3.4 index) of La Niña events and increased intensity of El Niño events.
Climatological normals are updated every ten to twenty years, which may significantly impact the detection of ENSO phases in the future. One alternative is to utilize the average of the thirty most recent years, though annually adjusting the climatology presents certain methodological challenges. A modified Niño3.4 index has also been proposed, which subtracts the mean SST across all tropical oceans, thereby representing only the SST anomalies above the global warming level (Geert Jan van Oldenborgh et al., 2021). Incidentally, the modified Niño3.4 value for SON 2024 was -0.8°C, indicating a moderate La Niña condition and closely aligning with the forecasted value. However, it is important to note that the current definition of La Niña remains based on the traditional index, and models continue to forecast against this metric.
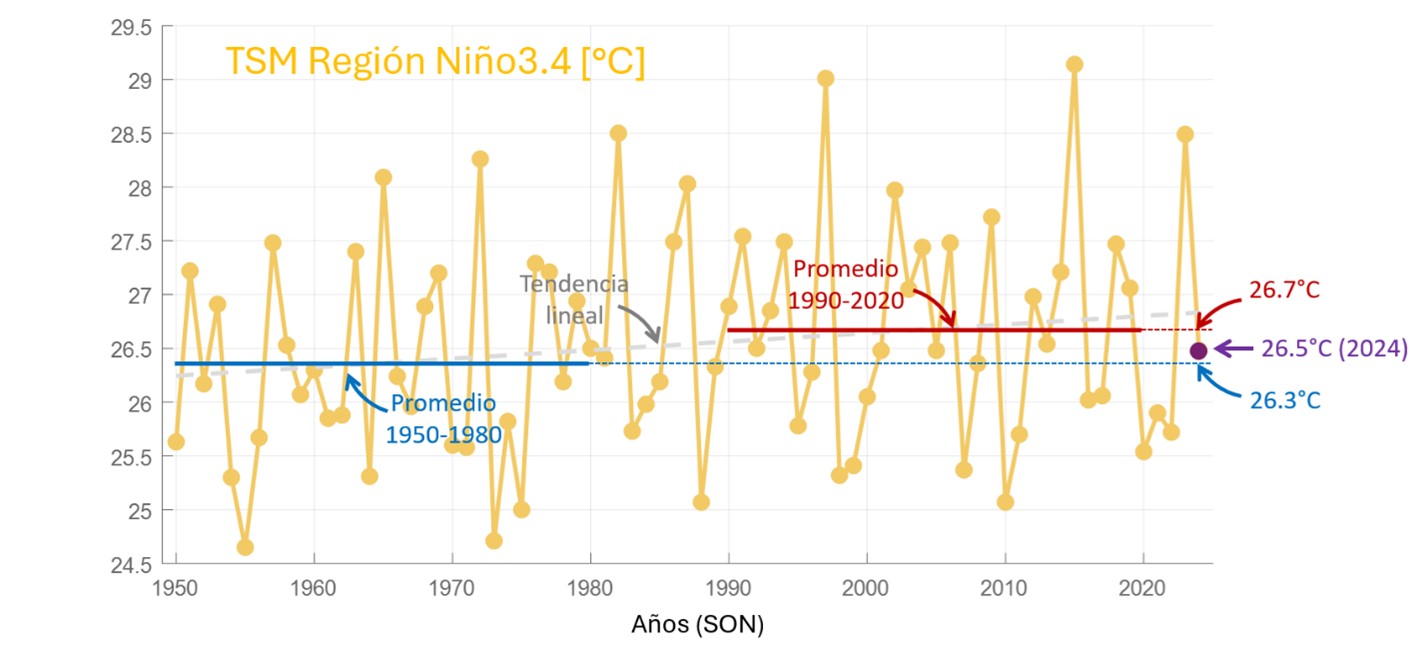
Figure 4. Average sea surface temperature for the austral spring quarter (SON) in the Niño3.4 region. Highlighted are the 1950-1980 average (historical climate typical), 1990-2020 average (current climate typical), and the 2024 SST value. Note that, due to long-term warming, the current Niño3.4 index would indicate slightly warm conditions if the historical climate typical is used as a reference.
Summary
If we reduce ENSO characterisation to the oceanic Niño3.4 index, forecast models correctly predicted El Niño’s establishment for 2023 six to nine months in advance. However, they generally underestimated the event’s actual magnitude. Conversely, the same models failed in 2024 by forecasting the establishment of a moderate La Niña that hasn’t materialised yet. Although the current Niño3.4 value (-0.27°C) indicates a neutral ENSO condition, other oceanic indices and Pacific cloud and wind patterns have recently shown weak La Niña characteristics.
Anticipating ENSO’s state is crucial for regional climate forecasts. For example, IRI’s climate precipitation forecast for South America this summer shows signals expected under La Niña conditions (compare panels a and b of Figure 5), including above-average precipitation in the continent’s northern zone and central Andes, along with below-average rainfall in southeastern South America. These regional forecasts, through numerical or statistical models, incorporate other climate modes (such as the Southern Annular Mode, warm blob, and Pacific Decadal Oscillation) that can be as or more influential than the ENSO signal, especially in cases like the present where ENSO is close to neutrality. An example is the Patagonian region, where IRI’s forecast indicates significant precipitation deficits, contrary to the pluviometric excess expected under a La Niña signal.
In the times of supercomputers and artificial intelligence, seasonal predictions remain a significant and pending challenge.
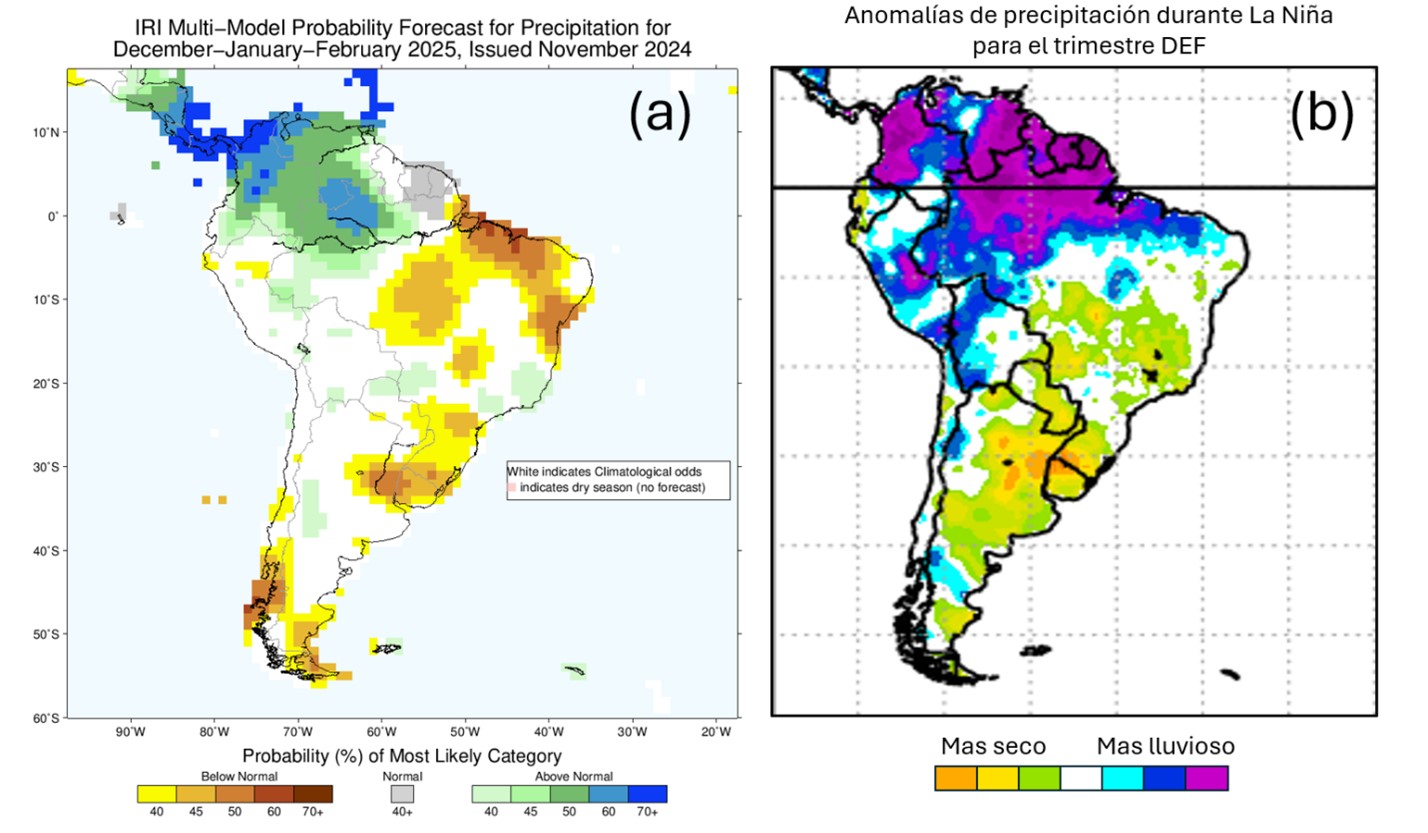
Figure 5. (a) Multimodel precipitation probability forecast for the DEF 2025 quarter, issued in November 2024 by the IRI. (b) Precipitation anomalies during La Niña for the DEF quarter. This map was created by correlating the Niño3.4 index with precipitation (U. Delaware) at each grid point. In both panels, warm colours indicate less precipitation than average, while cool colours indicate more precipitation than average.
Note
[1] The Niño3.4 index corresponds to anomalies (deviation from the long-term average) of sea surface temperature in the central and eastern tropical Pacific (average between 120°W and 170°W, and 5°N and 5°S)] CopyRetryClaude can make mistakes. Please double-check the responses. 3.5 SonnetConciseYou are out of complimentary messages until 8 PM
 Secures Its Continuity")

, an Endangered Species")