

René Garreaud, Deputy Director of the Center for Climate and Resilience Science (CR2) and Professor at the Department of Geophysics, University of Chile
Annual Precipitation Patterns
In Chile, precipitation and snowfall occur predominantly during winter (May through August, extending to September at most), while summer (December through February/March) represents the extremely dry season in certain regions. This marked seasonality, characteristic of Mediterranean climates, results from annual variations in the position and intensity of the Pacific subtropical anticyclone and the westerly wind belt in middle latitudes. Both systems reach their southernmost position during summer, inhibiting frontal systems from reaching central Chile.
This seasonality pattern, shared with four other “Mediterranean” regions”[1],
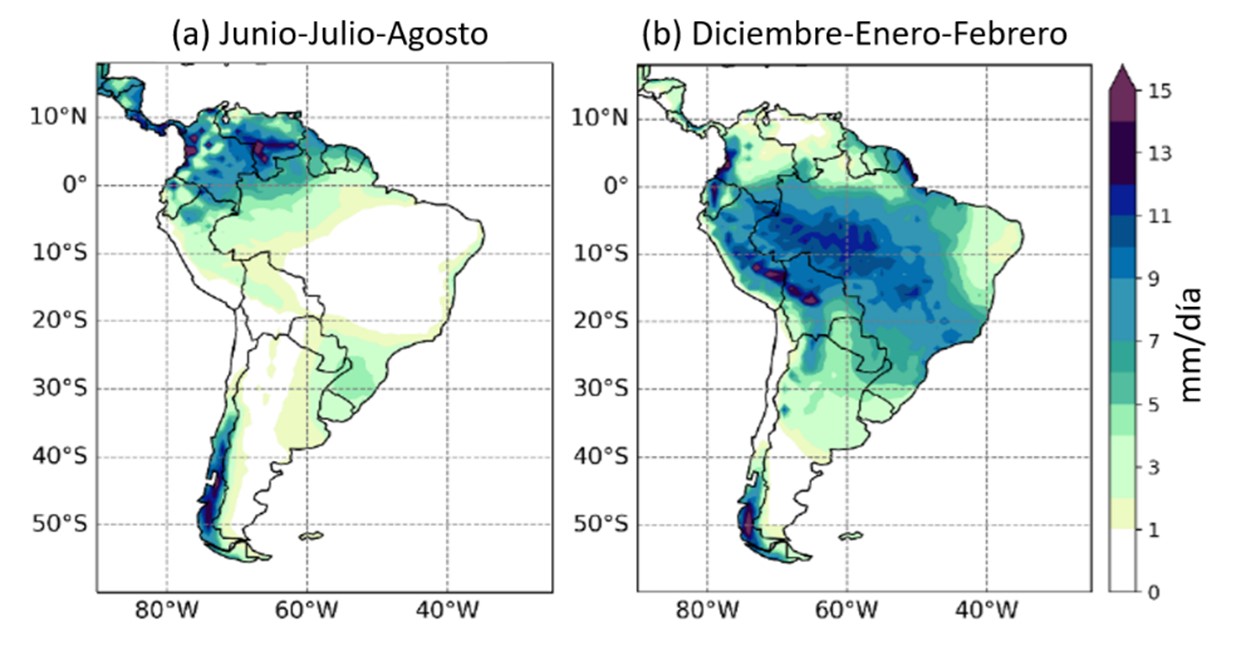
represents a global exception, particularly within our continent. Mid-latitudes still tend toward higher winter precipitation, though weather disturbances occur year-round. In lower latitudes—tropics and the terrestrial equator—precipitation is more frequent and intense during summer when solar radiation peaks. In South America, during the austral winter, significant precipitation is limited to south-central Chile, Uruguay, and southern Brazil (Figure 1a). During these months, precipitation is also abundant in Colombia and Venezuela, north of the equator, during their respective summer season. The central continental region (including the Amazon Basin and much of the La Plata Basin) experiences maximum precipitation during the austral summer (Figure 1b). This summer precipitation regime, typically called a monsoon climate, is primarily explained by increased atmospheric instability resulting from high levels of solar radiation reaching the continental surface.
The Altiplanic Winter
Precipitation in the central Andes (15-22°S) also concentrates almost exclusively between December and February. This region encompasses the South American Altiplano, an extensive plateau at approximately 3,800 meters above sea level, shared by Bolivia, Peru, and Chile, supporting a population of about three million. Consistent with its elevation, the Altiplano presents challenging climatic conditions, including low air density (approximately two-thirds of sea-level value), high solar radiation levels, and extremely low winter temperatures.
Wind convergence on the western and eastern slopes of the central Andes produces year-round ascending movements. Still, water vapour over the Altiplano typically remains too low to support cloud development and convection. Only between December and March do episodes lasting one to two weeks occur when humidity reaches levels sufficient to promote convective cloud formation, resulting in precipitation and electrical storms. Humidity thus represents the key factor in the occurrence of the altiplanic winter. (Vicencio-Veloso, 2024).
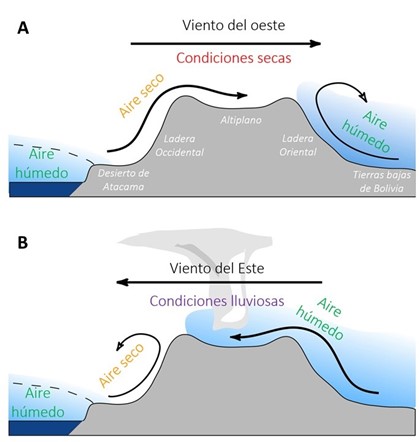
Figure 2. Schematic cross-section of the central Andes from the Pacific to the Bolivian lowlands, under (A) dry conditions and (B) rainy conditions over the Altiplano. The curved arrows indicate air movements over the mountain slopes. Moist air is represented by light blue shading. The arrow over the Altiplano indicates the general wind direction in the mid and upper troposphere. Source: Adapted from Falvey & Garreaud (2005).
Current Conditions
In 2024, the altiplanic winter began intensely and prematurely in mid-November, with heavy precipitation in the Bolivian and Peruvian sectors of the central Andes, as shown in the accumulation map for November 20-29, 2024 (Figure 3). Unfortunately, this has caused adverse effects in several Bolivian departments, including mudslides and flooding.
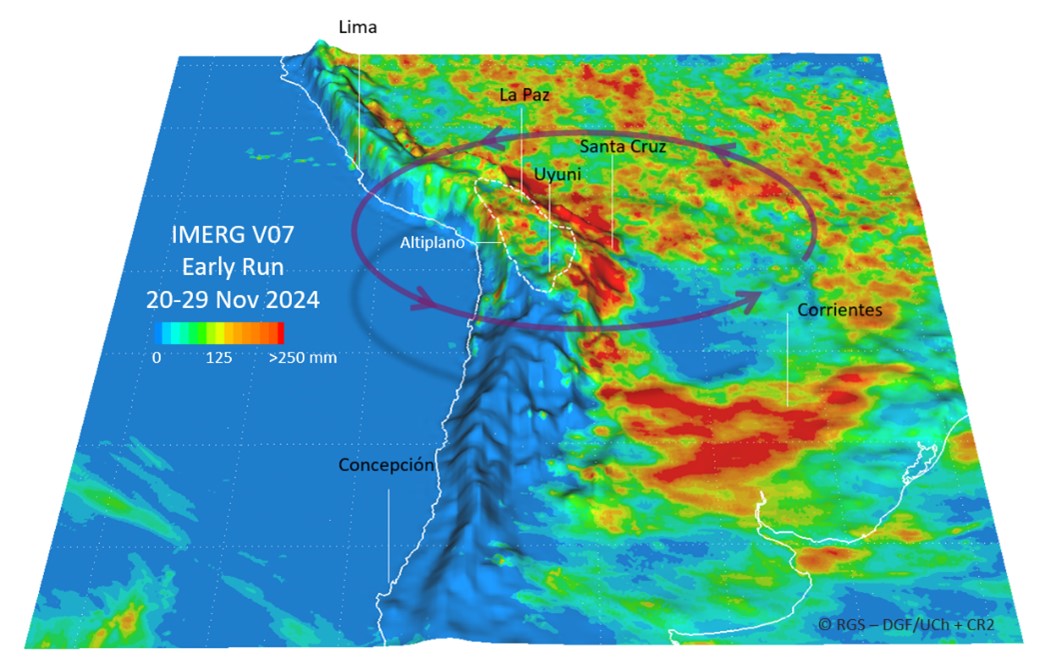
Figure 3. Accumulated precipitation over Central South America between November 20-29. IMERG V07 data. The oval with arrows represents high troposphere circulation (approximately 10-12 km altitude) around the Bolivian High.
During this period’s afternoons, storms extended to the Chilean edge of the Altiplano, as shown in Figure 4.
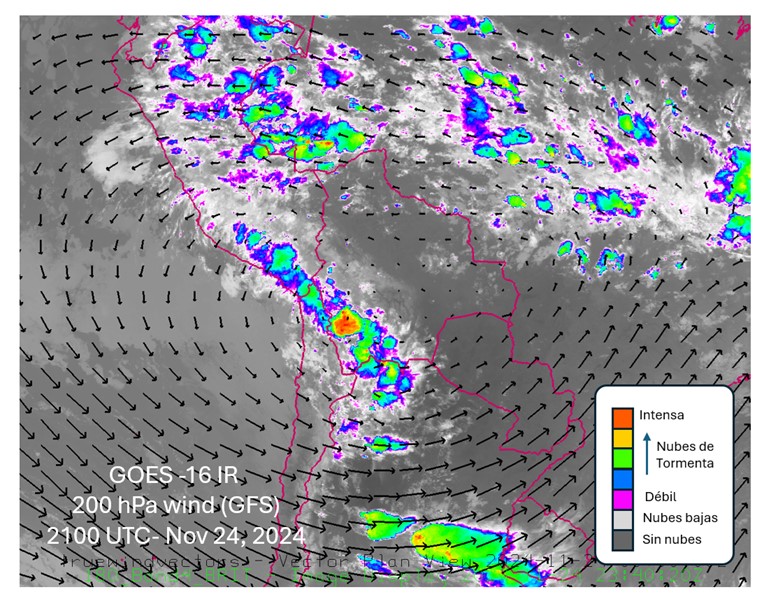
Figure 4. GOES-16 satellite image (IR channel) for November 24, 2024, at 7 PM (Chile time). The colour scale indicates convective cloud intensity. Arrows show wind at 200 hPa level (approximately 12 km altitude), as obtained from the GFS forecast. Border limits are shown in violet.
Above-normal precipitation in this zone is expected under “La Niña” conditions, though we await an official declaration of this status. From a local perspective, heavy rainfall over the Altiplano is attributable to the Bolivian High (BH) activation, producing easterly winds over the central Andes that transport humid air from the continental interior, as shown in Figure 2B. This mid and high troposphere circulation is more evident in NOAA’s CDAS analysis images below, where upper panels represent the average for November 23-29, 2024, and lower panels show anomalies (difference from climatology):
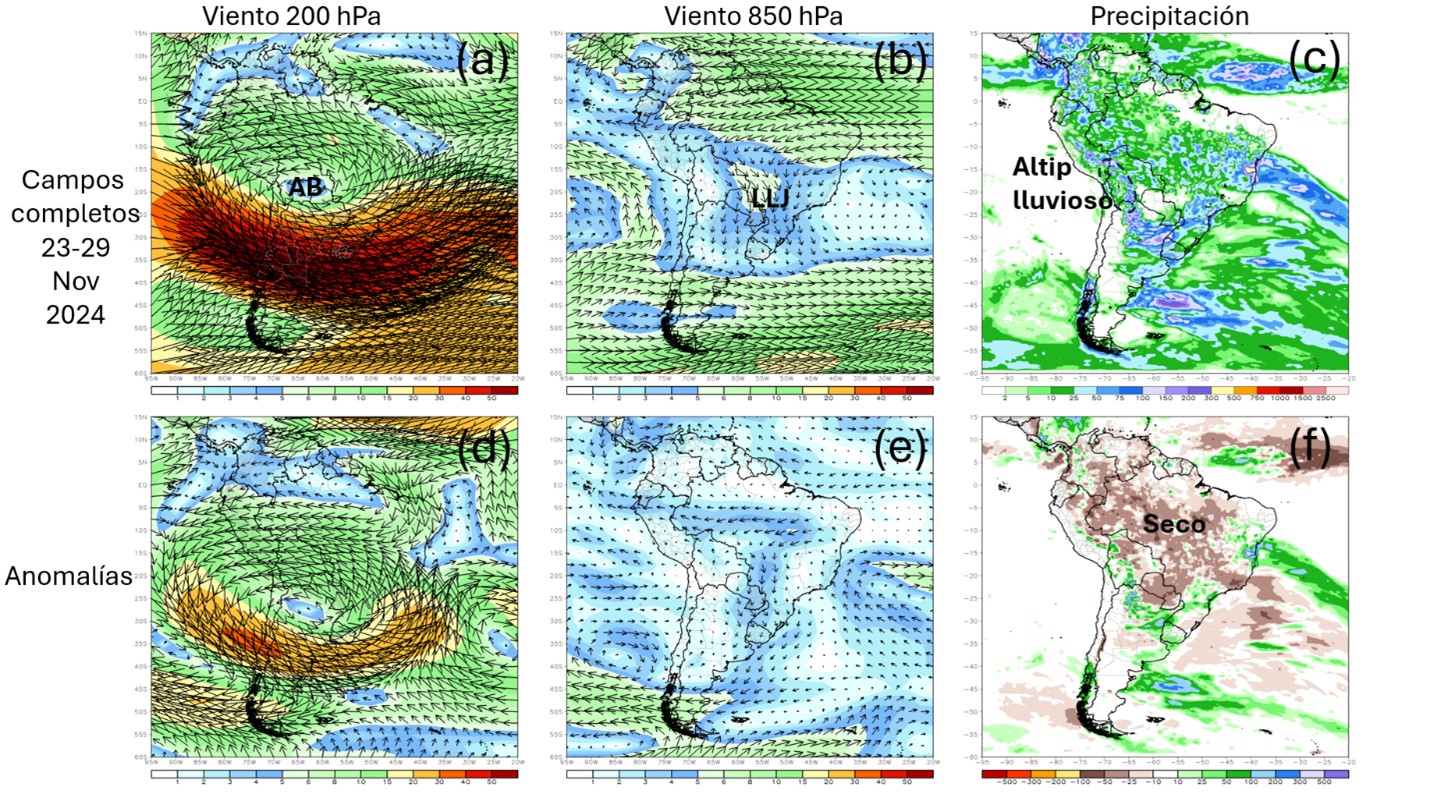
Figure 5. The upper panels show the average between November 23-29, 2024, of wind at: (a) 200 hPa (approximately 12 km height), (b) 850 hPa (approximately 1.5 km height), and (c) precipitation. Lower panels show anomalies from climatology
Source: Climate Prediction Center, NOAA, USA.
These maps indicate that the Bolivian High has been more intense than average and positioned slightly south of its usual location, causing easterly winds over the central Andes. The low-level northern jet (strong winds blowing from the north below 2000 meters above ground) is relatively regular over Bolivia but significantly more intense over southern Brazil and Paraguay. This appears to have fueled intense storms over northern Argentina in previous days.
Many South American summer climate studies indicate that the Bolivian High results from latent heat release over the continent’s interior and the South Atlantic Convergence Zone (Lenters & Cook, 1997). While correct for seasonal averages, this pattern appears absent at the start of this season. As precipitation maps show, rainfall has been deficient over Amazonia, southern Brazil, and the South Atlantic Convergence Zone.
What, then, is causing this intense Bolivian High? One possible explanation is forcing originating in the tropical Pacific travelling as a Rossby wave, suggested by the alternation of anomalous low and high pressures, as shown in Figure 6. The chain’s final node corresponds to the Bolivian High.
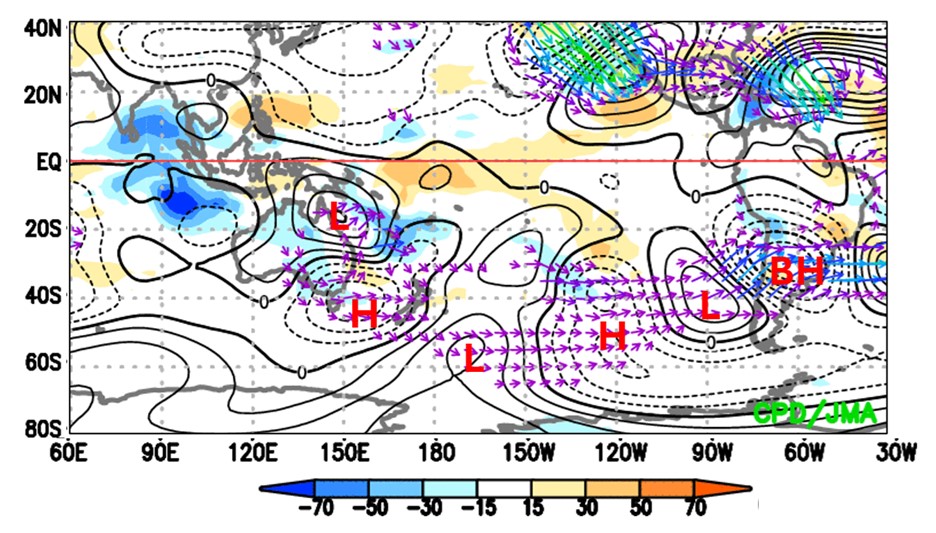
Figure 6. Circulation anomalies between November 20-27, 2024. Shading indicates outgoing longwave radiation anomalies (OLR; W/m²). Warm colours indicate suppressed convection and cold colours indicate above-average active convection. Black contours show 200 hPa streamfunction anomalies at 5×10⁶ m²/s intervals. Purple arrows indicate 200 hPa wave activity flux (m²/s²). H letters indicate high pressure, L indicates low pressure, and BH is the Bolivian High. Source: Tokyo Climate Center.
Beyond its origin, developing an operational diagnostic and forecast product for the Bolivian High would be valuable. This would enable monitoring of its position and intensity, from which we could infer aspects of precipitation over the central Andes.
References
Clarín. 2 de diciembre de 2024. Cinco provincias en alerta por tormentas fuertes con ráfagas y ocasional caída de granizo. https://www.clarin.com/sociedad/tormenta-lluvia-viento-pais-alerta-buenos-aires-provincias-rojo_0_VuG3Rijsh8.html?srsltid=AfmBOorsXfHi0NGXsL1AfqZ2pXC0_RPN-2JxVRe1i9Unv7OzPY9J3Z8W#google_vignette
El País. 26 noviembre de 2024. Seis de los nueve departamentos de Bolivia en alerta por desbordes de ríos ante inicio de época de lluvias. https://www.elpais.cr/2024/11/26/seis-de-los-nueve-departamentos-de-bolivia-en-alerta-por-desbordes-de-rios-ante-inicio-de-epoca-de-lluvias/
Falvey, M., & Garreaud, R. D. (2005). Moisture variability over the South American Altiplano during the South American low level jet experiment (SALLJEX) observing season. Journal of Geophysical Research: Atmospheres, 110(D22).
Ferreira, G. W., & Reboita, M. S. (2022). A new look into the South America precipitation regimes: observation and forecast. Atmosphere, 13(6), 873.
Garreaud, R., Vuille, M., & Clement, A. C. (2003). The climate of the Altiplano: observed current conditions and mechanisms of past changes. Palaeogeography, palaeoclimatology, palaeoecology, 194(1-3), 5-22.
Lenters, J. D., & Cook, K. H. (1997). On the origin of the Bolivian high and related circulation features of the South American climate. Journal of the Atmospheric Sciences, 54(5), 656-678.
Vicencio Veloso, J., Böhm, C., Schween, J. H., Löhnert, U., & Crewell, S. (2024). The overlooked role of moist northerlies as a source of summer rainfall in the hyperarid Atacama Desert. Journal of Geophysical Research: Atmospheres, 129(21), e2024JD041021.
Notes
[1] Other Mediterranean climate regions include the European Mediterranean, California, South Africa, and southeastern Australia
 Secures Its Continuity")

, an Endangered Species")