

René Garreaud, Deputy Director, Center for Climate and Resilience Research (CR)2 ; and Martín Jacques, principal investigator, Center for Climate and Resilience Research (CR)2
The “hot blob” is an extensive area of the southwestern Pacific Ocean – east of New Zealand – that was characterized by marked surface warming in December 2019, with temperatures up to 3°C above climatological values, as shown in Figure 1.
Although the “blob” attracted the attention of some media outlets, the phenomenon is not new. Research carried out in Chile (Garreaud et al. 2019) has shown that warm anomalies have dominated the upper layer of south-western Pacific waters over the past two or three decades. The “blob” has also been blamed as one of the main causes of the prolonged megadrought in central Chile. Despite the fact that long-term warming in this part of the ocean has been more noticeable and prolonged in the winter months, what is surprising here is the unexpected warming at the start of summer. In this short note, we offer a hypothesis about its origin and consequences.
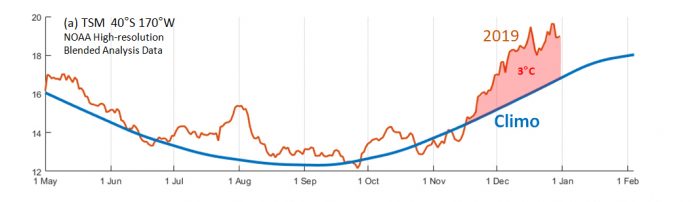 Figure 1: Evolution of the sea surface temperature (SST) in the south-western Pacific Ocean (40° S 170° W) from 1 May to 31 December 2019 (red curve). For reference, the blue curve indicates the historic average SST in the same area. Source: NOAA-High resolution blended analysis.
The “hot blob” is located at the north-western edge of an area of the South Pacific dominated by positive pressure anomalies at sea level (identified as A2 in panel B of Figure 2). This high pressure centre induces anomalous winds from the north (thick black line in the same panel), which are capable of transporting warm water from the subtropical zone directly towards the blob, which is located at middle latitudes. The circulation anomaly also causes surface water to sink, thereby preserving the heat within it. The “hot blob” thus appears to be a consequence of the high pressure anomaly at the centre of the South Pacific, which was prominent (>6 hPa) for the entire month of December 2019.
If this hypothesis is correct, the next question is, what is the origin of this anticyclonic anomaly that causes the hot blob? To explore this, we can observe panel A in Figure 2, which represents phenomena that occur in the high troposphere at an altitude of 12 kilometres. The warm (reddish) colours indicate a precipitation deficit, most notably the prominent drought that affected the Maritime Continent (Borneo, Indonesia, and Northern Australia) in December 2019. While an absence of convection and rainfall prevailed in this region, the opposite was observed in the Indian Ocean (east of Madagascar and south-west of Australia), which showed above-normal convective activity. This dipole of precipitation seems to be the origin of the circulation anomalies in the high troposphere, represented in panel A of Figure 2 by alternating centres of cyclonic (B) and anti-cyclonic (A) circulation at 200 hPa. This Rossby wave train remained stationary for much of December. It is important to note that one of its anticyclonic nodes (A) is located precisely above the south-western Pacific, which helps to keep the high pressure centre at the surface (A2), which in turn sustains the “hot blob.”
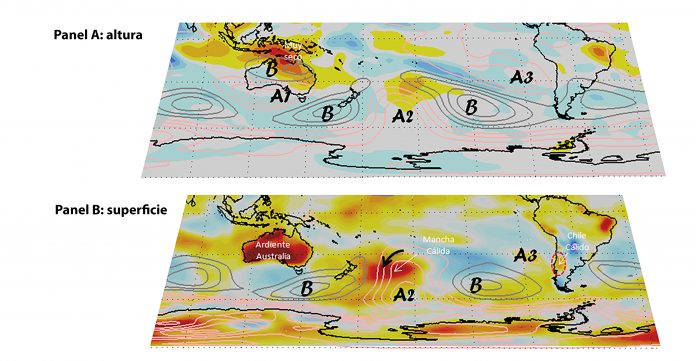 Figure 2: Panel A: Emerging infrared radiation anomaly (colours) and 200 hPa geopotential (contours every 20 mgp) for December 2019, at altitude. Panel B: Surface temperature anomaly (colours) and sea level pressure (contours every 2 hPa) for December 2019, surface level. Source: NCEP/NCAR reanalysis (pressure) and NOAA (radiation).
The absence of rainfall on the Maritime Continent and its presence in the Indian Ocean are associated with the Madden-Julian Oscillation (MJO), the primary mode of subseasonal climatic variability in the tropics (Zhang, 2005). This causes the dry/rainy centres at the equatorial belt to shift slowly eastwards. Although the MJO was mostly inactive in December 2019, in the middle of that month it manifested in a way consistent with the absence/presence of precipitation described above.
We also note that both at surface level (panel B Figure 2) and at altitude (panel A figure 2), there is a third high pressure centre (A3) off the coast of central Chile. This centre reinforces the Pacific tropical anticyclone, meaning it increases the descent of air, and consequently reduces the mid-level winds blowing in from the ocean. Both factors (air descent and wind reduction) contributed to the record high temperatures recorded last month in central Chile. Santiago, for example, experienced an average high temperature of 31.4°C, more than 2°C above the climatological value.
But the warm start to summer in much of central Chile is not a consequence of the hot blob per se; instead, both conditions seem to be associated with a large-scale disturbance in the Southern Hemisphere, provoked by anomalies in the tropical precipitation regime over the Indian Ocean and the Maritime Continent. This connection between the tropics and south-central Chile is modulated by the MJO and has emerged as a trigger for extreme events in the recent past (Jacques-Coper et al. 2016; Garreaud 2018; Rondanelli et al. 2019).
So, taking all of this into account, what do we expect to happen with the wave train, the hot blob in the Pacific, and the heat in Chile? After having completed a cycle, the forecasts indicate that the MJO will become active in the first two weeks of January 2020. Thus, it is expected that the absence of rainfall in the Maritime Continent and its presence in the Indian Ocean will shift eastwards, and also that the Rossby wave train will change according to the position of its centres of action. In particular, it is expected that convective conditions in the second week of January 2020 will replace the air descent anomaly observed in December 2019 above the Maritime Continent, perhaps alleviating the unprecedented forest fire season that devastated south-eastern Australia. As a result, it is likely that the high pressure that sustains the blob will also shift, causing it to diminish in intensity in the coming weeks. Ultimately, we expect to have a breather from the high temperatures in central Chile in the first half of January, then a return to high temperatures as of the second half of the month. Following the mechanisms indicated above, this perspective is supported by the development of a Rossby wave train with tropical and extratropical contributions. As we have mentioned in this note, this kind of analysis is becoming particularly useful for forecasting extreme climatic conditions during the 2019-2020 summer.
References
Jacques-Coper, M., Brönnimann, S., Martius, O., Vera, C., Cerne, B. 2016: Summer heat waves in southeastern Patagonia: An analysis of the intraseasonal timescale. International Journal of Climatology. 36(3), pp. 1359-1374
Rondanelli, R., Hatchett, B., Rutllant, J., Bozkurt, D. and Garreaud, R. 2019: Strongest MJO on Record Triggers Extreme Atacama Rainfall andWarmth in Antarctica. Geophysical Research Letters, 46.
Garreaud, R. 2018: A plausible atmospheric trigger for the 2017 coastal El Niño. Int. Journal of Climatology.
Garreaud, R., Boisier, JP., Rondanelli, R., Montecinos, A., Sepúlveda H. and Veloso-Águila, D. 2019: The Central Chile Mega Drought (2010-2018): A Climate dynamics perspective. International Journal of Climatology. 1–19.
Zhang, C. 2005: Madden-Julian Oscillation. Rev. Geophys. 43: RG2003.
 Secures Its Continuity")

, an Endangered Species")