

By Deniz Bozkurt, associate researcher at (CR)2, and Roberto Rondanelli, associate researcher at (CR)2 and academic DGF-FCFM Universidad de Chile
In the first part of this analysis, we made a brief historical review of the satellites and their importance in studying the geophysical processes of our planet. In this second part, we will see concrete examples of how this technology has contributed to science.
16 Year Old Melted Antarctic Ice Sheet
The Ice, Cloud, and land Elevation Satellite 2 (ICESat-2) is the most advanced laser Earth-observing instrument NASA has ever flown in space. It was launched into orbit in 2018 to take detailed global elevation measurements, including the frozen regions of Earth. With this satellite, the researchers found that the net loss of ice from Antarctica and the decrease in the Greenland ice sheet have been responsible for a sea-level rise by 14 millimeters globally since 2003.
The precision and high resolution of ICESat-2 allows researchers to measure general changes without worrying about complex aspects of ice sheets, such as rough surfaces with cracks and ridges. By comparing the new data with measurements taken by the original ICESat – between 2003 and 2009 – the researchers have generated a comprehensive portrait of the complexities of ice sheet change and insights into the future of Antarctica and Greenland.
In Antarctica, for example, ICESat-2 measurements showed that the ice sheet is thickening in parts of the continent’s interior, likely as a result of increased snowfall. But the loss of ice from its margins, especially in West Antarctica and the Antarctic Peninsula, far outweighs any gain in the interior (Figure 1). What’s more, specialists found that some ice shelves in West Antarctica are losing mass with thinning rates averaging up to five meters of ice per year.
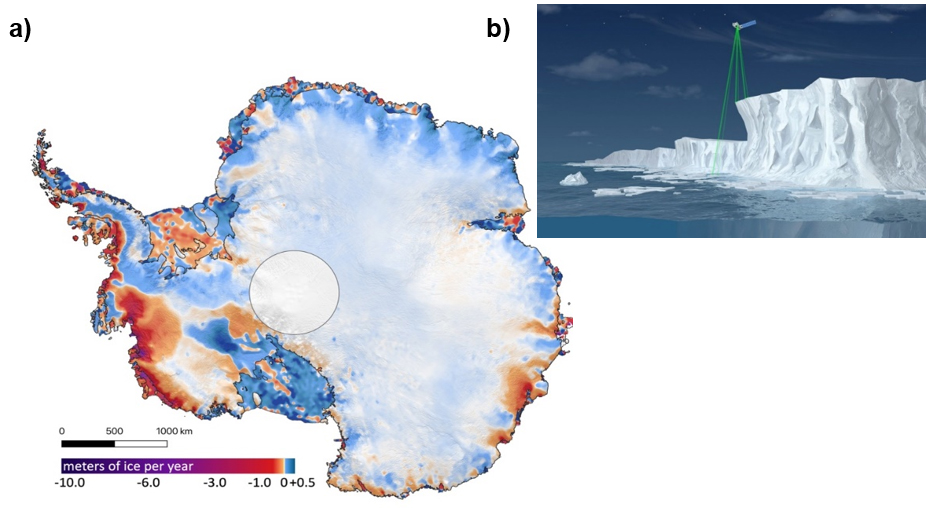 Figure 1. a) With data obtained by the ICESat and ICESat-2 satellites, the map shows the amount of ice gained and lost in Antarctica between 2003 and 2019. The dark red and purple areas show significant average rates of near-shore ice loss, while blue zones show lower rates of inland ice gain. The lost ice near the coasts, especially in West Antarctica and the Antarctic Peninsula, far exceeds the increases in the interior. In the middle circle, the satellites do not collect data. The figure is taken from Smith et al. (2020). b) The small visualization shows how ICESat-2 works: it uses six lasers (green) to measure elevations over an ice sheet. Source: NASA, ICESat-2 / SCAD Collaborative Student Project.
Sahara Desert Dust Transportation in 2020
The transport of the huge dust cloud that formed over the Sahara desert in mid-June 2020 and spread across the North Atlantic Ocean due to the prevailing westward winds (trade winds) was also monitored with the help of satellite images.
In the image taken by the infrared imaging radiometer (VIIRS), together with the Suomi NPP satellite (NASA-NOAA), on June 21, 2020, the dust cloud is seen traveling from the coast of West Africa to the South American continent across the North Atlantic Ocean, over an area of at least 5,000 kilometers length and more than 5 kilometers depth (Figure 2a). Typically, the transport of dust from African deserts across the Atlantic Ocean occurs at certain times of the year. These mineral-rich powders can favor the ecology of the lands they reach (for example, the Amazon basin) and, due to their extremely dry characteristics, can modify the radiation that reaches the surface. It can also suppress the growth of cyclones that form in the tropical Atlantic. However, due to the context of the pandemic and given that this year’s event was more intense and thicker than in recent decades, there was concern that lung and respiratory diseases could be triggered by the fine particulate material carried by this cloud of dust. The aerosol index values obtained by the Suomi NPP satellite show high concentrations of aerosols that can affect human health, which turned out to be exceptionally high off the coast of West Africa and off the coast of South America (Figure 2b).
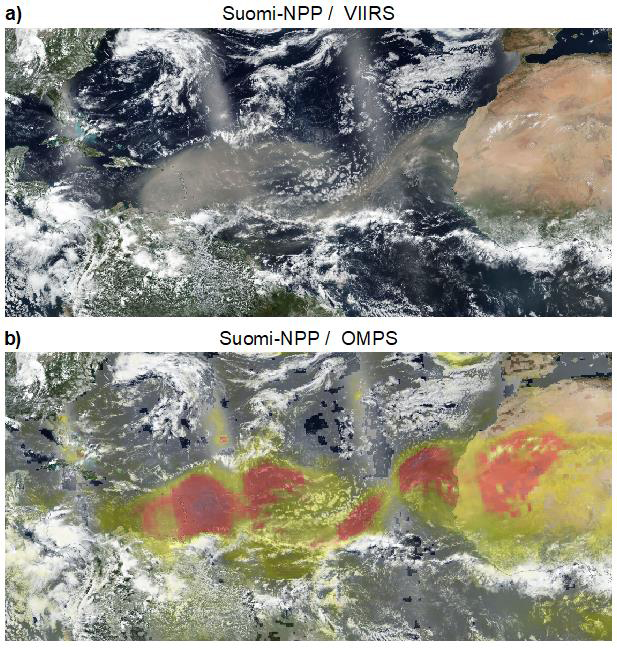 Figure 2. a) Satellite image visible in true color or natural color (resolution: 250 m), dated June 21, 2020, 00 UTC, obtained by the VIIRS radiometer of the Suomi NPP satellite. b) Viewing the Suomi NPP satellite image for the same date, combined with the aerosol index obtained from the ozone mapping profile (OMPS) (resolution: 2 km). The aerosol index is a unitless range between 0.0 and 5.0; a value of 5.0 indicates high concentrations of aerosols that can reduce visibility or affect human health. Red and its shades indicate pixels with an aerosol index range between 3.0 and 5.0. Image and data source: NASA Worldview (https://worldview.earthdata.nasa.gov/).
The Atacama storm of March 2015
In the Atacama Desert, an extremely unusual storm caused severe flooding between March 24 and 26, 2015. Total accumulated precipitation reached up to 100 mm in some places (tens of times the average annual rainfall in just two days). Due to the absence of rainfall observations in this desert environment, a detailed analysis of this event was possible using satellite data. For example, the analysis based on the maximum brightness temperature of the clouds obtained from the infrared images of the GOES-13 satellite (NASA / NOAA) showed that the maximum temperatures of the clouds over the Atacama desert and in the coastal areas were relatively warm compared to the surrounding areas (Figure 3a). Therefore, the lower altitude of the stratus and/or nimbostratus-type clouds in these regions was very effective for precipitation production. In parallel, the analysis based on the intensity and type of precipitation data obtained from NASA-TRMM showed the formation of severe convective precipitation (a type of intense precipitation lasting minutes to hours). That precipitation type occurs due to the mountainous and complex terrain (Figures 3b, 3c, and 3d) in places with no surface data. Therefore it would have been impossible to check whether produced or not precipitation.
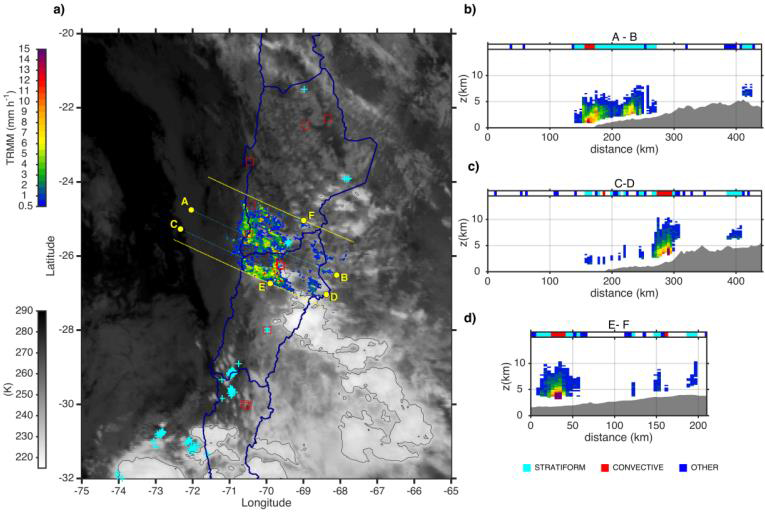 Figure 3. a) Images of clouds, rain intensity, and lightning over the Atacama desert (18oS-26oS) obtained from the GOES-13 and TRMM satellites, dated March 25 at 11:00 UTC. Precipitation intensities obtained by TRMM near the surface are shown in color (resolution: 4 km, mm / hour). The parallel lines indicate the orbital area of the TRMM satellite. The luminance temperature of the grayscale cloud (K) was obtained from infrared images (resolution: 4 km) from the GOES-13 satellite. The blue “+” signs indicate the location of the lightning bolts, determined with data from the Global Lightning Network (WWLLN). b), c), d) Vertical cross-section and classification of precipitation that occurs along the sections shown in a), obtained from TRMM-PR (Precipitation Radar) data. Source: Bozkurt et al. (2016).
In summary, with the images obtained from satellites in Earth orbit, we not only enjoy a visual feast, but we can also analyze the situations that directly affect the components of our climate system. Therefore, satellites’ continued functionality and products are crucial to better contextualizing climate change, particularly in remote areas.
References
Smith, B., Fricker, H. A., Gardner, A. S., Medley, B., et al. Pervasive ice sheet mass loss reflects competing ocean and atmosphere processes, Science, 368, 1239–1242, 2020. https://doi.org/10.1126/science.aaz5845
Bozkurt, D., Rondanelli, R., Garreaud, R., Arriagada, A. Impact of warmer eastern tropical Pacific SST on the March 2015 Atacama floods. Monthly Weather Review, 144 (11), 4441-4460, 2016. Doi: https://doi.org/10.1175/MWR-D-16-0041.1
NASA Worldview, https://worldview.earthdata.nasa.gov/
NASA Space Laser Missions Map 16 Years of Ice Sheet Loss: https://www.nasa.gov/feature/goddard/2020/nasa-space-laser-missions-map-16-years-of-ice-sheet-loss
 Secures Its Continuity")

, an Endangered Species")