
By Martín Jacques Coper, (CR)2 principal investigator; René Garreaud, (CR)2 director; and Roberto Rondanelli, (CR)2 associate researcher.
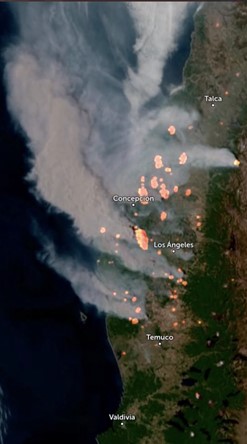
During the first week of February 2023, we have witnessed the devastation by forest fires of extensive areas in the Ñuble, Biobío and Araucanía regions (Figure 1). So far in the summer period 2022-2023, nearly 310,000 hectares have already been consumed (CONAF, 2023), which amounts to more than seven times the annual average of the last five years (2018-2022).
Forest fires in Chile are multi-causal, the product of the overlapping of several factors, mainly the presence of fuel (in this case, mostly plant biomass from plantations of exotic species), ignition events (fire initiation) and propagation. of fire. In central-southern Chile (the macrozone between the Valparaíso and Los Lagos regions), practically all fires are caused by human action, whether due to accidental or intentional causes (González et al., 2020). While to the north fires are usually limited by the lower availability of fuel, to the south, the climate and meteorology tend to limit their spread and, therefore, their extension (Urrutia-Jalabert et al., 2018). However, extreme weather events, particularly during the summer, can favor the development of fire and make it difficult to fight it. In this analysis we will focus on this meteorological dimension.
Maximum temperature records
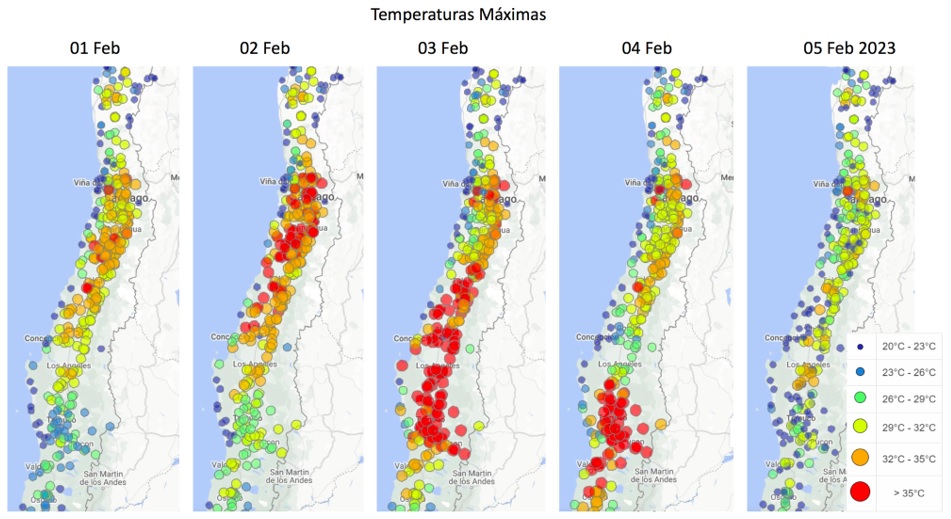
During November and December 2022, central-southern Chile registered exceptionally warm temperatures. However, January 2023 ended as a relatively moderate month in terms of maximum temperatures, considering the records of the last decade, and there were practically no heat waves. The exception was Curicó and surroundings, where a heat wave lasted from January 28 to February 4. It must be clarified that the absence of heat waves does not mean that high temperatures have not been observed, as can be seen in figure 2.
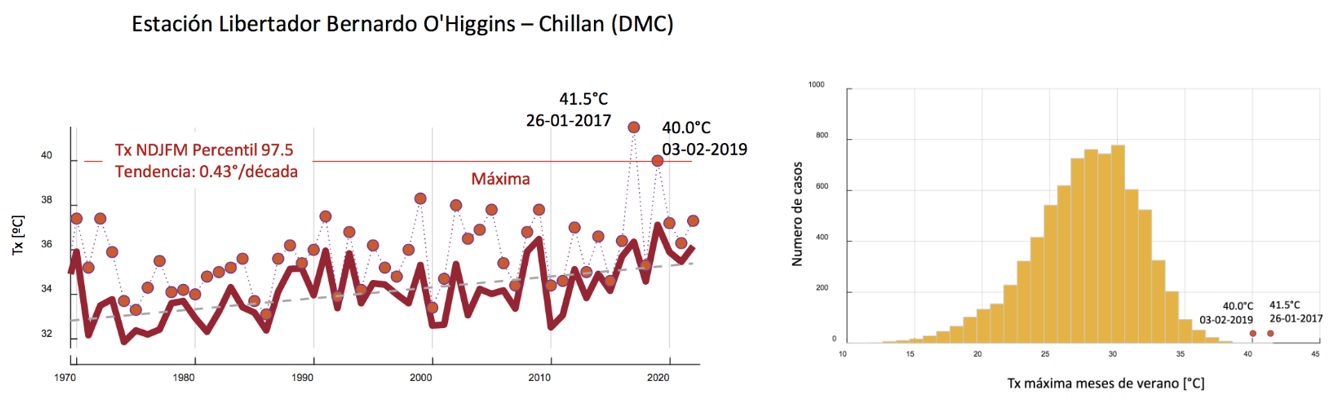
Heat waves, by definition, must register maximum temperatures above a certain threshold for at least three consecutive days. No matter how intense the maximum temperature is, if this persistence does not occur, the phenomenon will only be defined as an “extreme heat event”. This was the case on Friday, February 3, which, despite not being a heat wave, did reach several extreme temperature records in several areas: Concepción registered 34.4 ºC (its record values per month are 37.5 ºC, in January 1935, and 37 ºC, in February 1953) and Chillán reached a new record with 41.6 ºC (the previous one was 41.5 ºC, in January 2017). As Figure 3 shows, this record is very anomalous in the distribution of historical values of maximum temperature in Chillán, and an estimated return period of over 100 years is calculated. This extreme situation was predicted very precisely by numerical weather models and, consequently, the Chilean Meteorological Service issued meteorological warnings and alerts at the end of January.
Over the last fifty years, maximum summer temperatures have increased steadily at a rate of 0.43ºC per decade—a rate much greater than the average temperature change for the planet—as a result of increases in greenhouse gases in the atmosphere and anthropogenic global warming. It should be noted that all events with maximum temperatures above 40 °C have occurred in the last decade.
The synoptic configuration determines favorable conditions for the spread of fire
Extreme weather conditions, even if they are not classified as heat waves, can be a determining factor in the spread of fire, particularly in central-southern Chile (McWethy et al., 2021). This was observed in December 2022, in the Biobío and Los Ríos regions. If there are no relevant sources of humidity, the increase in temperature to extreme values implies an equally extreme decrease in relative humidity. Indeed, on Friday, February 3, 2023, this variable fell even below 10% in the central valley of Chile.
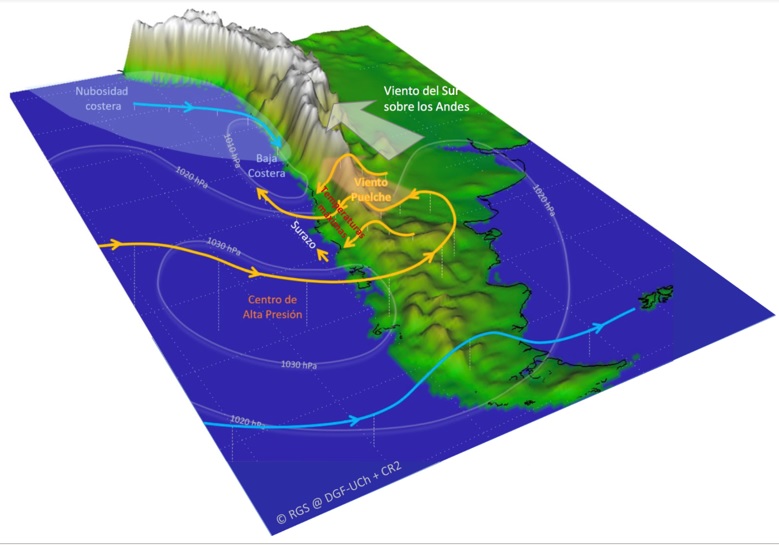
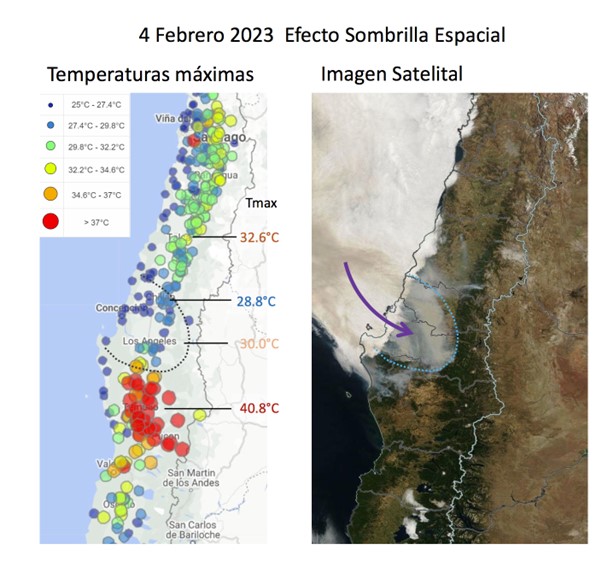
Extreme heat and low humidity are factors that favor the development of fires, but the wind also plays a major role. A center of high pressure (which in meteorology we call migratory anticyclone) determines conditions of atmospheric stability, that is, absence of cloudiness and high atmospheric radiation favored by the decrease in air masses. When this condition occurs, the dominant wind from the West in mid-latitudes is replaced by the “Puelche”, a wind that blows from the East in the Andean sectors and is characterized by being hot and dry. Meanwhile, on the coast and the central valley, the migratory anticyclone (together with the coastal low located to the North) causes a wind coming from the South that, due to its intensity, is commonly called “Surazo”. This configuration of the wind is undoubtedly decisive for the spread of fire. Indeed, Figure 1 clearly shows a northward component in fire development and smoke spread. In addition to this, topographic factors can generate mesoscale wind systems and produce particularly damaging gusts for fighting fires.
Smoke, pollution and the “umbrella effect”
Forest fires are exceptional sources of pollutants injected into the atmosphere. According to the National Air Quality Information System, PM2.5 records have reached extremely high emergency values in the Ñuble and Maule regions. In addition, the smoke has reached locations hundreds of kilometers away. From a meteorological perspective, it is also interesting to highlight the effect that the cloud of pollutants has on the temperature. As Figure 2 shows, on Saturday, February 4, the most intense signal of maximum temperature moved to the south and positioned itself over the regions of La Araucanía and Los Ríos. In fact, that day extreme temperatures of 41 ºC were recorded in Temuco and 38.1 ºC in Valdivia, both values very close to historical records. This was the consequence of a shift to the south of the migratory anticyclone. However, apparently the fires themselves also influenced the weather that day. Figure 5 shows the considerable decrease in maximum temperature in the Ñuble and Biobío regions (left panel), which were under the influence of the intrusion of coastal cloudiness (indicated by the arrow), restored along the coast after the culmination of the coastal low. This was superimposed by the cloud of smoke produced by the fires (right panel). This phenomenon is called the “umbrella effect” and we witnessed a similar situation in Santiago de Chile in December 2022. Thus, as has been reported in other places and occasions, fires can modify the very atmospheric conditions in which they develop; These are the so-called “sixth generation fires”.
Comparison between the 2017 and 2023 seasons
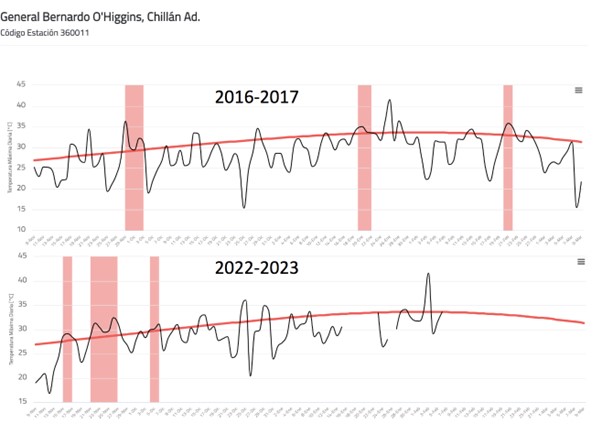
The number and area burned by the recent fires are reminiscent of the tragic season of 2017, when almost 600,000 hectares were consumed in January and February, which represents ten times the average value of a fire season. Figure 6 shows the evolution of the maximum temperature in Chillán between November and February, comparing the 2016-2017 and 2022-2023 seasons. Both seasons show a similarity, since there is a marked interday variability of the temperature determined by the succession of synoptic configurations typical of this latitude. It should be emphasized that the maximum historical values of maximum temperature in this area, of 41.5 ºC and 41.6 ºC, were registered, precisely, in these two seasons. Furthermore, in both cases, the records correspond to escaped values that occur in a very particular context: a sequence of particularly hot days during the hottest period of summer.
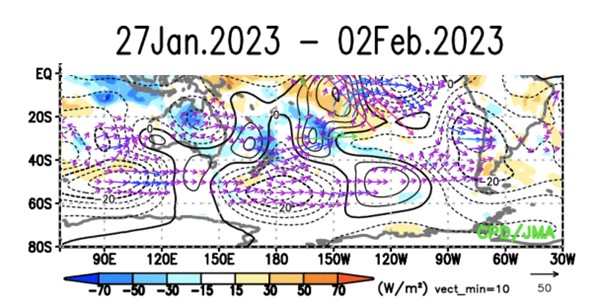
In both seasons, these meteorological conditions developed under the influence of the mega-drought in central-southern Chile, which has already completed 13 years. To this is added that they were also preceded by “La Niña”, which entails less rainfall. In the summer, this lower frequency of rainy conditions can result in a higher frequency of clear afternoons and, therefore, more hours of solar radiation and higher temperatures. In addition to the mega-drought and La Niña, it should be noted that the weather conditions that cause heat waves in this part of the world can also be modulated by phenomena that occur in distant places in the southern hemisphere (Jacques-Coper et al., 2021; it is recommended to see the Monitoring platform for remote precursors of heat waves in central-southern Chile). This was evidenced in the so-called ‘firestorm’ of 2017, whose synoptic configuration was preceded and modulated, in part, by an atmospheric phenomenon that occurred in Oceania that caused copious rainfall in northern Australia (González et al., 2020). Interestingly, a week before the current 2023 fires began in Chile, we observed a similar situation: heavy rains in the tropical and subtropical sectors, particularly in northern Australia. In fact, as reported by the Bureau of Meteorology of that country, anomalous precipitation values were recorded in that region. This distant phenomenon acts as the trigger for an atmospheric wave, a “wave train”, which propagates for days until it reaches South America and intensifies the high pressure (migratory anticyclone) outlined in Figure 4, causing an increase in temperatures. In this way, several atmospheric parallels are appreciated between the dramatic fire seasons of 2017 and 2023.
Weather outlook
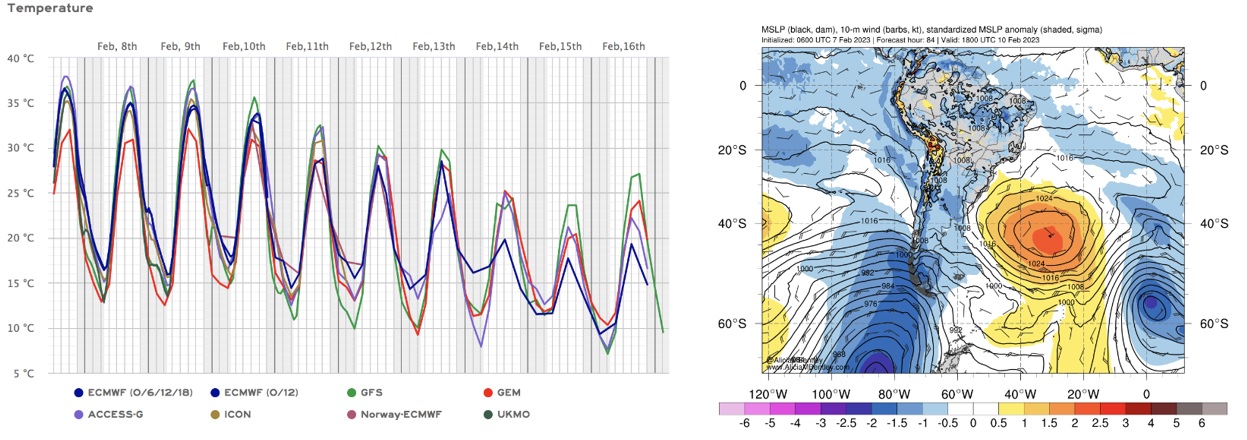
After a brief drop in temperature on the weekend of February 4 and 5 in Chillán, a new migratory anticyclone is determining a configuration like that of Figure 4 during the period between Monday, February 6, and Friday, February 10.
The left panel of Figure 8 shows that forecasts generated by various global models anticipate temperatures that may be around 35ºC this week (but not record highs), which is representative of conditions that would favor the spread of fires. Fortunately, as illustrated in the right panel, the arrival of a frontal system in the southern zone of our country is expected for the weekend, which will impact a drop in temperature in the center-south zone, attenuating the favorable conditions for the spread of fires. Even a rear-frontal system could cause showers in this area around Tuesday, February 14.
As we previously indicated, forest fires are phenomena with multiple causes. Chile is particularly vulnerable to these events, as has been tragically revealed in its history and, unfortunately, once again in these days. Climate change projections towards the end of the century show a growing threat from the climatic and meteorological perspective (IPCC, 2022). Therefore, decision-making to mitigate the corresponding impacts must be based on evidence. Concrete recommendations have been developed and shared in the (CR)2 Report to the Nations “Fires in Chile: causes, impacts and resilience” (González et al., 2020).
References
CONAF. (2023). Situación nacional de incendios forestales. https://www.conaf.cl/situacion-nacional-de-incendios-forestales/
González, M.E., Sapiains, R., Gómez-González, S., Garreaud, R., Miranda, A., Galleguillos, M., Jacques, M., Pauchard, A., Hoyos, J., Cordero, L., Vásquez, F., Lara, A., Aldunce, P., Delgado, V., Arriagada, Ugarte, A.M., Sepúlveda, A., Farías, L., García, R., Rondanelli, R.,J., Ponce, R.,Vargas, F., Rojas, M., Boisier, J.P., C., Carrasco, Little, C., Osses, M., Zamorano, C., Díaz-Hormazábal, I., Ceballos, A., Guerra, E., Moncada, M., Castillo, I . (2020). Incendios forestales en Chile: causas, impactos y resiliencia. Centro de Ciencia del Clima y la Resiliencia (CR)2, (ANID/FONDAP/15110009), 84 pp. Available in https://www.cr2.cl/incendios/ (English version: https://www.cr2.cl/eng/forest-fires-in-chile-causes-impacts-and-resilience/)
IPCC. (2022). Climate Change 2022: Impacts, Adaptation, and Vulnerability. Contribution of Working Group II to the Sixth Assessment Report of the Intergovernmental Panel on Climate Change [H.-O. Pörtner, D.C. Roberts, M. Tignor, E.S. Poloczanska, K. Mintenbeck, A. Alegría, M. Craig, S. Langsdorf, S. Löschke, V. Möller, A. Okem, B. Rama (eds.)]. Cambridge University Press. Cambridge University Press, Cambridge, UK and New York, NY, USA, 3056 pp., doi:10.1017/9781009325844.
Jacques‐Coper, M., Veloso‐Aguila, D., Segura, C., & Valencia, A. (2021). Intraseasonal teleconnections leading to heat waves in central Chile. International Journal of Climatology, 41(9), 4712-4731. https://doi.org/10.1002/joc.7096
McWethy, D. B., Garreaud, R. D., Holz, A., & Pederson, G. T. (2021). Broad-scale surface and atmospheric conditions during large fires in South-Central Chile. Fire, 4(2), 28. https://doi.org/10.3390/fire4020028
Urrutia‐Jalabert, R., González, M. E., González‐Reyes, Á., Lara, A., & Garreaud, R. (2018). Climate variability and forest fires in central and south‐central Chile. Ecosphere, 9(4), e02171. https://doi.org/10.1002/ecs2.2171
 Secures Its Continuity")

, an Endangered Species")